Mon to Sat: 09:00 am to 05:00 pm
-
-
-
United Kingdom
Mon to Sat: 09:00 am to 05:00 pm
United Kingdom


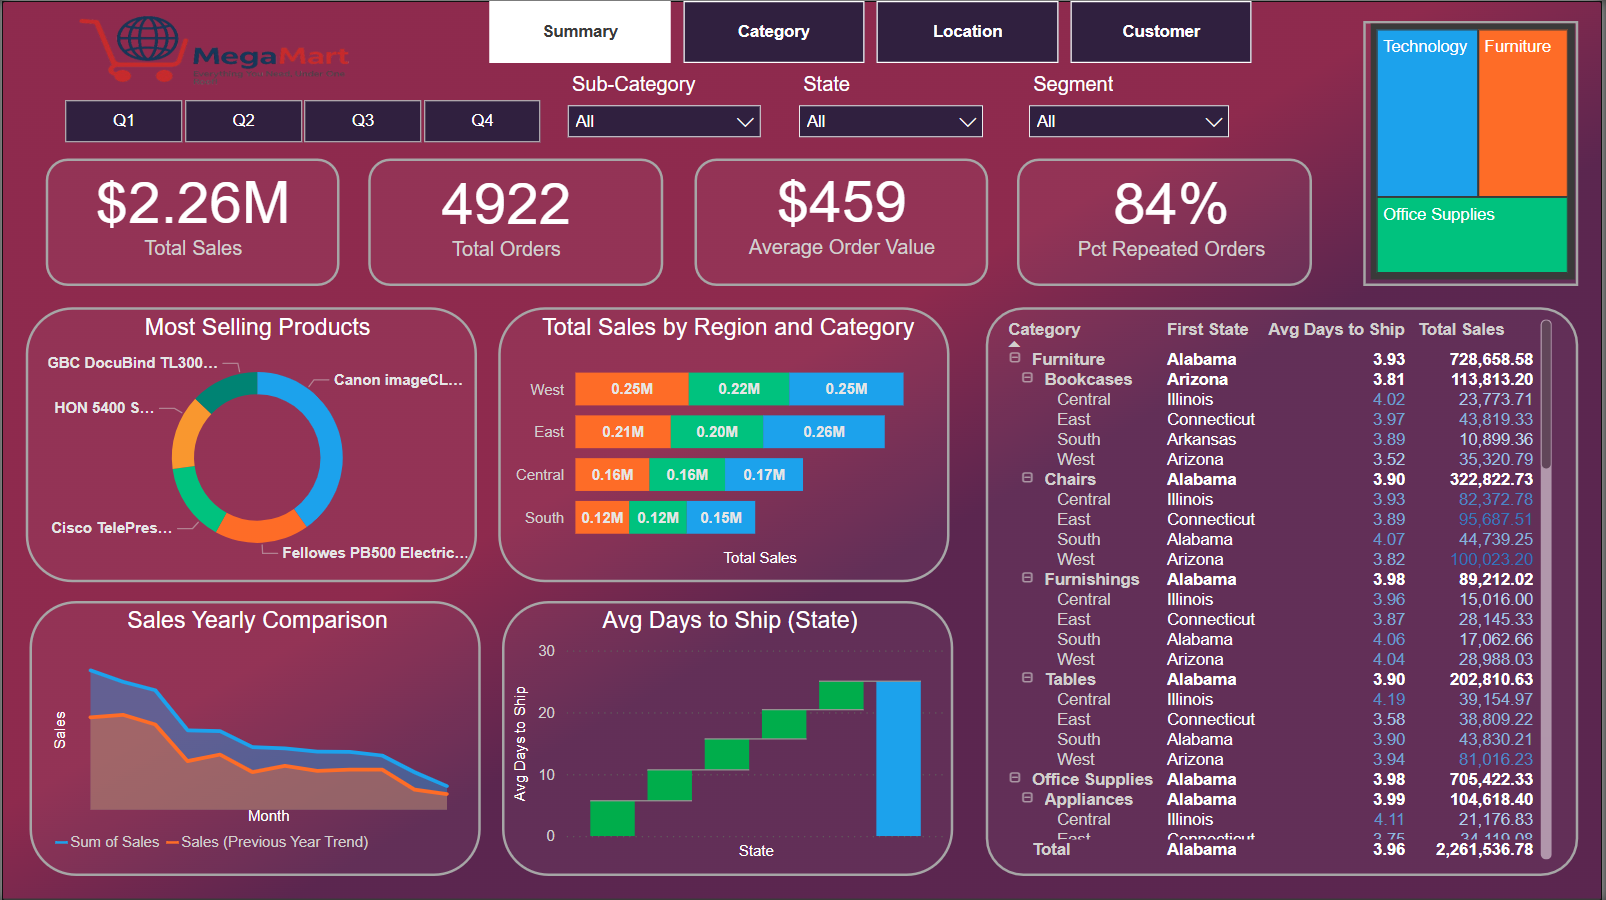
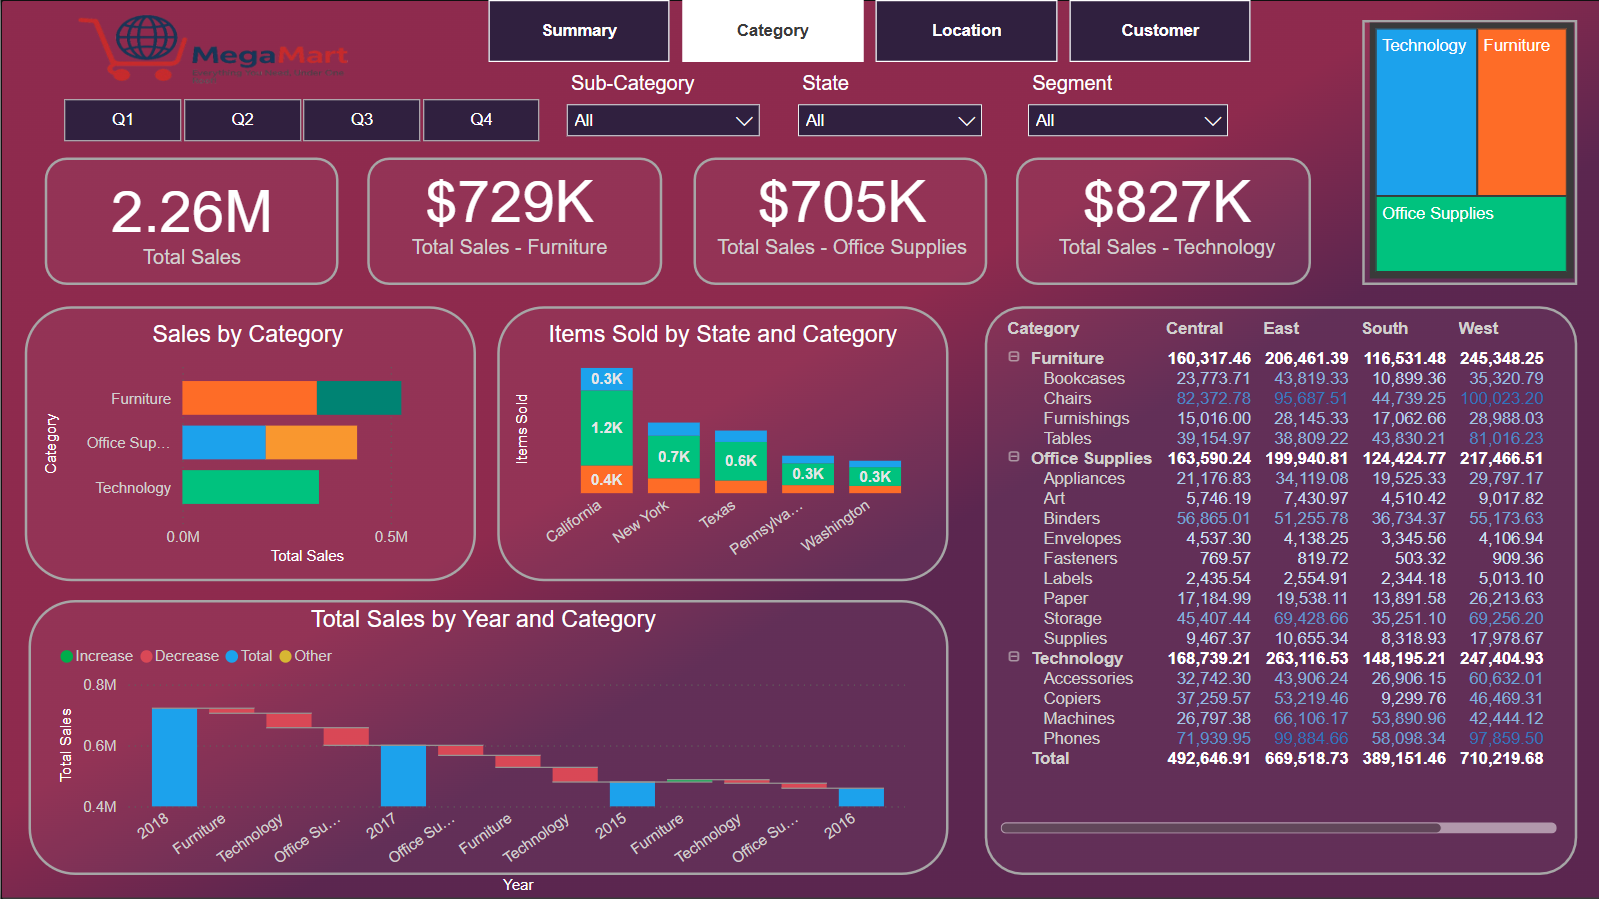
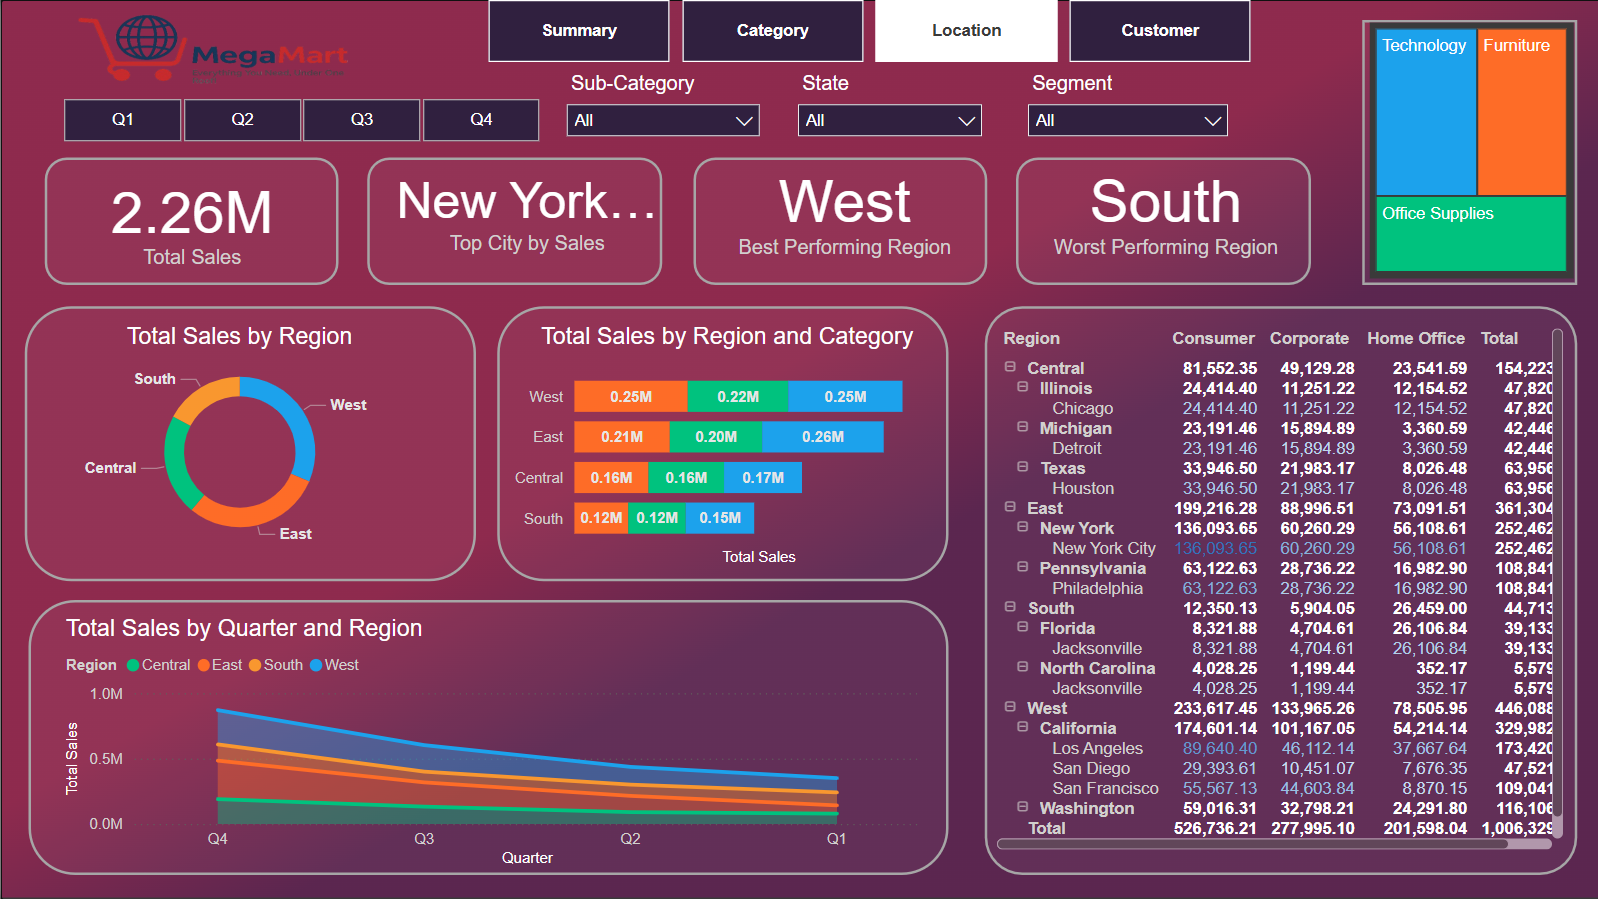
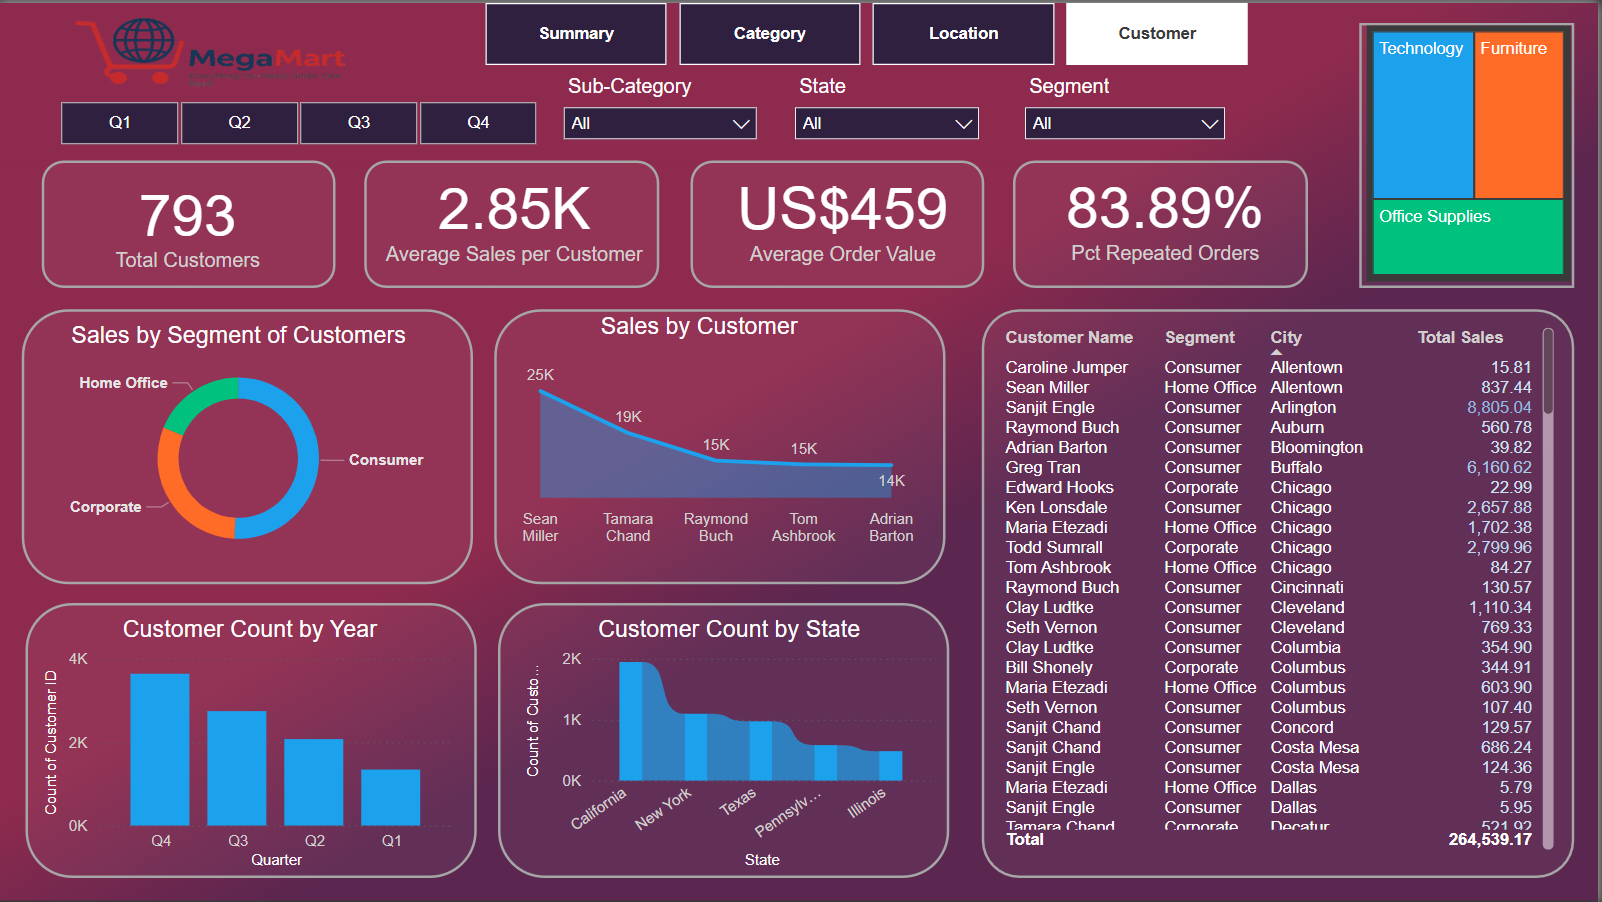
This project was developed for one of our retail superstore clients to modernize their operations and decision-making process. By combining advanced data engineering, custom machine learning models, and interactive dashboards, we enabled the client to gain actionable insights into customer behavior, sales trends, and inventory management. The platform delivers real-time analytics, predictive forecasts, and automated reporting, ensuring operational efficiency and smarter business decisions across multiple store locations.